
公司简介
我公司是一家有着16年工作经验的IT技术服务公司;本公司为各行各业提供专业的IT技术服务,经过不懈的努力与发展,已具一定的规模及实力,现拥有技术精湛的IT服务团队,以卓越的服务品质、专业安全的技术服务实力,为不同群体的用户提供更高更优质的IT服务。我们的理念:“以诚为本、以信为先,全心全意为客户”,我们公司秉承客户至上、服务至上的经营理念,以卓越的IT服务品质、专业的技术服务实力、技术精湛的客户服务团队,保障客户在信息时代的高速路...

最新文章Recommend News
- 252023-10
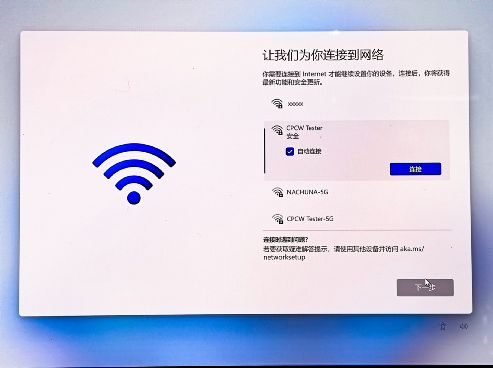
- WIN11不联网激活--方法
win11激活跳过联网设置的方法
- 252023-10
- WIN10 共享打印机设置 简介
设置共享打印机,简介,共享,设置,安装,调试等
- 102021-11
- QQ能上网页打不开怎么回事,电脑能上QQ打不开网页如何解决
很多人在问QQ能上网页打不开怎么回事呢?QQ能正常使用,就是网页相关的都打不开,而且会有网卡...
- 052021-07
- 无线防蹭网秘籍,防止别人蹭网必备绝招
世界上最遥远的距离就是,我与WiFi仅有一墙之隔,但我并不知道WiFi密码!无线网络 防蹭网...
- 302021-06
- win10控制面板不见了怎么办,win10控制面板在哪里?
windows...